

Here's an overview I wish I had when I began with mapping. Wardley Mapping adds an evolutionary-analytical lens to how you understand the practices and technologies you work with. Making maps forces you to understand the situation through this new lens, and iteratively improve your understanding as you go.
Everything evolves: Batteries began as custom-built ceramic jars. Now they're standardized, well-specified, essentially invisible components. Photography belonged, at first, to the realm of the alchemists. It's in our pockets, on our computers, and in the cloud, now. Artificial intelligence that could converse, convincingly, as if human, once was simply speculation...
That everything evolves, in an inevitable march from novel wonder to commoditized ubiquity, is the ground truth in strategy with Wardley Mapping. Propelled by supply-and-demand competition, this evolution is the basis for understanding and visualizing the environment of strategic play.
Everything evolves, even the practice of strategy itself. Wardley Mapping, nascent nearly 20 years ago, is gaining traction as a comprehensive means of taking on strategic work, including product development, team or resource allocation, and organizational transformation.
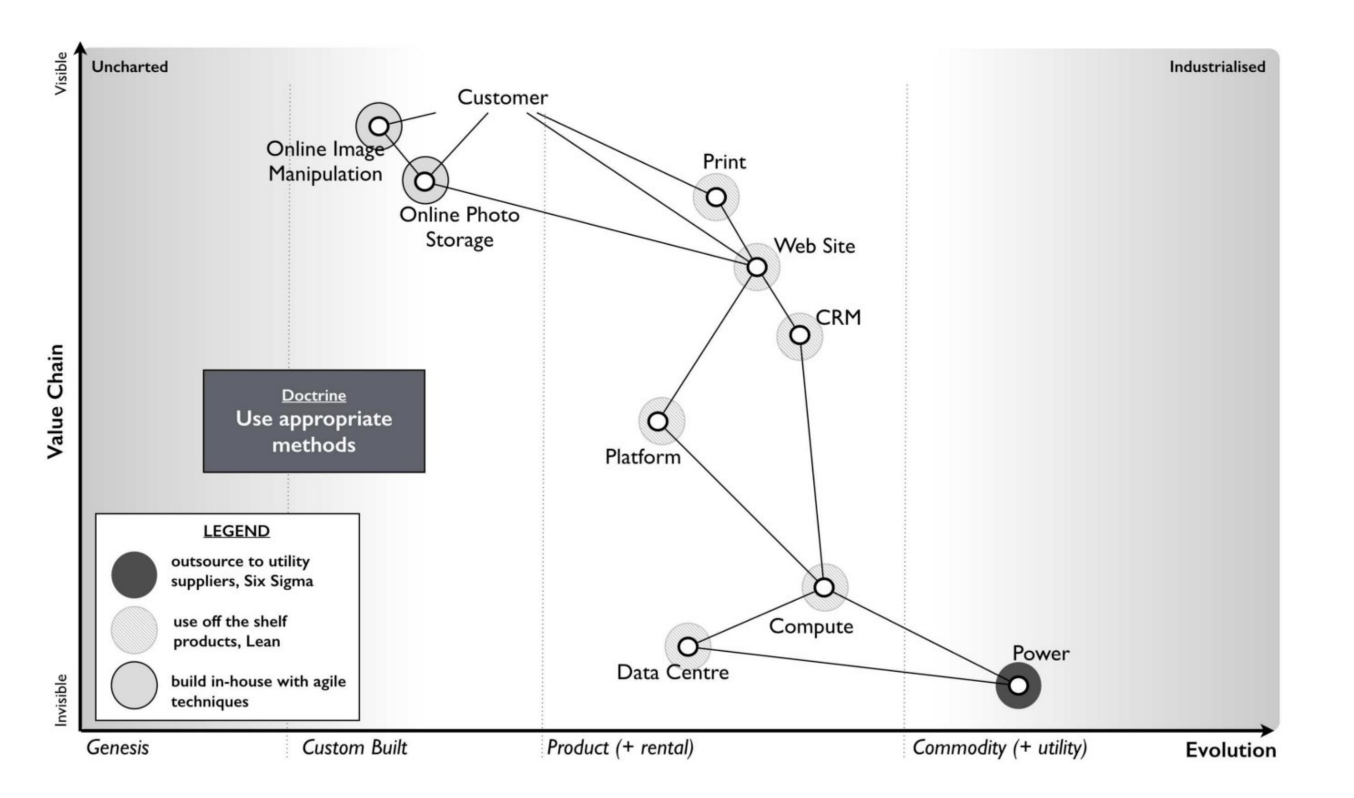
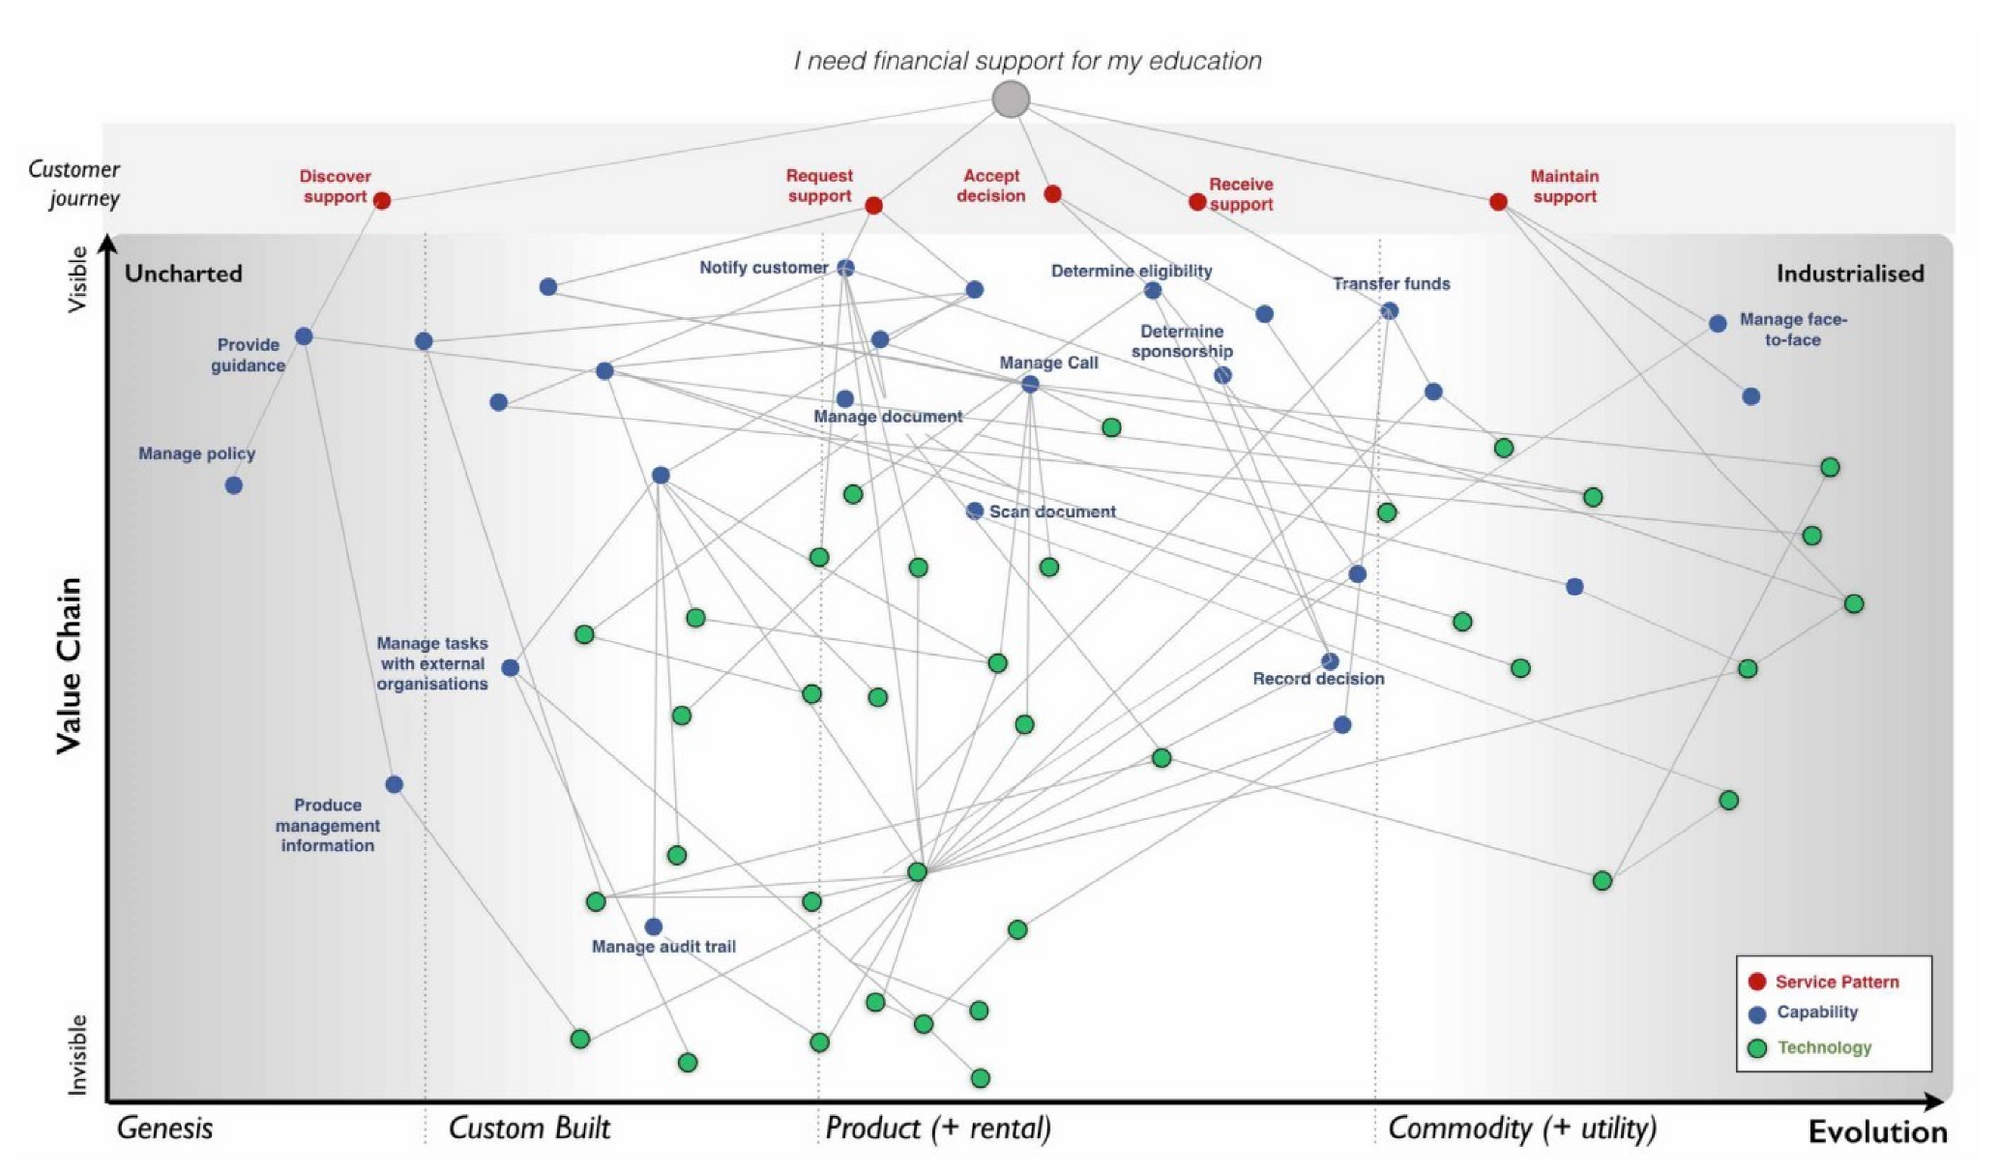
Doing the work of strategy well requires making visible and discussable that which was felt but was previously invisible. (We need to show the schwerpunkt.) Wardley Maps push us to break our business and our market space down into discrete value chains, building situational awareness — and strategy — according to the evolutionary state of each component. Here are a few examples:
Wardley maps take a strategic situation — in our cases, a product, business, or technical situation — and make what we're playing with visible. We chart out the gameboard and the kinds of pieces we're playing with. Each part of the game is a capital stock — an activity, practice, data, or knowledge — and no matter which piece that is, it evolves through a set of predictable stages. This perspective turns strategy into a concrete, contextual game that we can see, discuss, deliberately act on, and learn from, over time.
The maps, a strong visual totem, are only the beginning of a coherent strategic practice. They're one of many important areas (the third, in this list) in a larger framework:
- The Strategy Cycle
The mapping perspective sees strategy as a cyclical process, blending John Boyd's OODA loop with five factors of strategy from The Art of War. - Stages of Evolution
Everything evolves through the same kind of path of novel wonder to commodity competition. We can identify four stages along this trajectory. Each stage presents different characteristics and requires different methods to understand and manage components. - Context-specific Maps
The most important thing about a Wardley map is that it's visual: a gameboard that lets us see the pieces in strategic play. Each piece is a value chain component, flowing down from an anchor of user need, with an evolutionary position along the map's x-axis. - Climatic Patterns
Components evolve and co-evolve in predictable ways. Individual organizations have different levels of awareness and impact on that evolution. Sources of value can be predicted even if their timing and instantiation may not. The patterns of climate help us understand future motion. - Patterns of Doctrine
Playing the game well goes beyond simply seeing the board and knowing the moves. Universally useful patterns that describe how to operate strategically, are expressed across phases of organizational adoption. - Forms of Gameplay
The game itself acts on the various, evolving components of strategic value chains, and known "moves" are described as gameplay. These include means of forcing or inhibiting the inevitable evolution of the market and effectively managing organizational capital throughout the stages of evolution. We know, so far, of 61 different kinds of moves.
In this Part 1 on Wardley Mapping, we'll examine the first three parts in depth, going from zero to map.
1. The Strategy Cycle
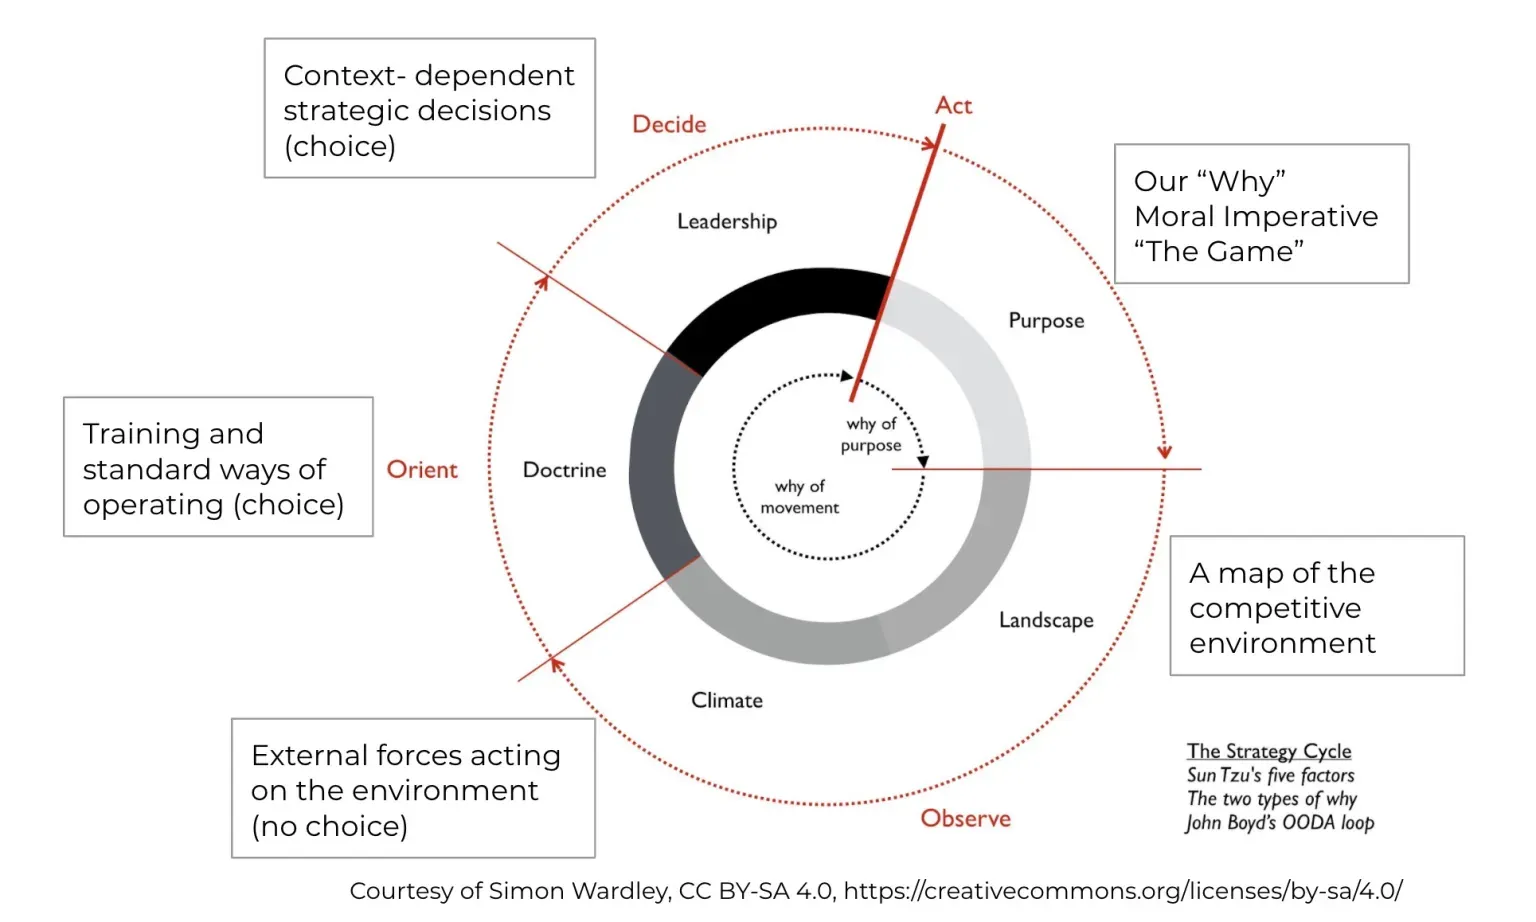
Strategy is cyclical, adaptive, and ongoing. Wardley's strategy cycle is a combination of John Boyd's OODA loop (Observe, Orient, Decide, and Act) and the five factors of strategy from Sun Tzu's The Art of War (Purpose, Landscape, Climate, Doctrine, and Leadership.)
This is our widest frame of reference on the path to coherent, strategic action.
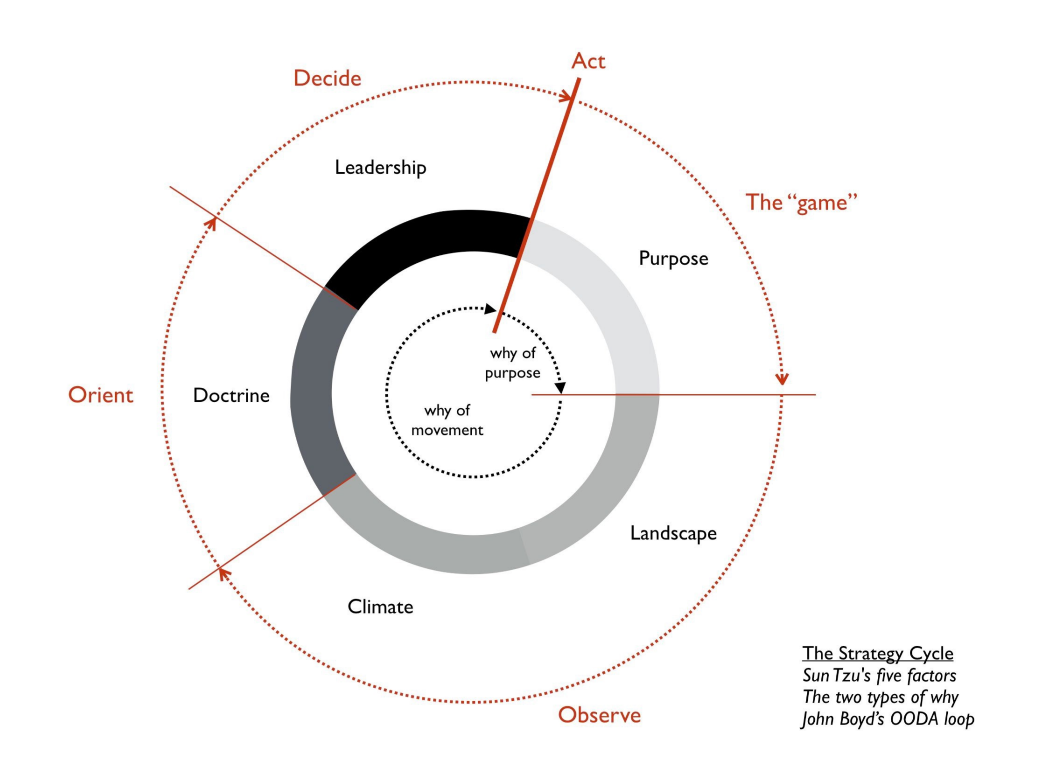
We start by separating two kinds of 'why' in the center of the strategy cycle diagram. The first why is the reason we're in the game, our why of purpose and the first of Sun Tzu's five factors. Our purpose may change as we work the cycle, but it's our primary baseline: without a clear purpose, we have no basis for any subsequent decisions and actions.
Next, in the inner circle, is the why of movement: why make any given move instead of any other? This second why aligns with each stage of Boyd's OODA loop, as well as the progression through The Art of War's final four factors of strategy: Landscape, Climate, Doctrine, and Leadership.
With a purpose in mind and a map in hand, we can start moving through the strategy cycle — from this higher-order frame, all other pieces fall into place.
Implications for our work
The landscape and climate factors from The Art of War make literal sense in a military context, with troops moving through a real-world landscape: that's a gameboard we can map, understand, and plan moves with. We need the same kind of thing to complete the cycle in business and product strategy effectively: that's a Wardley map.
We learn more about our position, our landscape, and the game itself with every iteration. The first attempt at moving through this cycle starts by making a map and understanding what it tells us about our reality. This effort alone — attempting to see our landscape and the conditions acting upon it — is extremely instructive as we set the foundations for a strategic practice.
Boyd's development of the OODA loop in a military context spoke to the speed of decision cycles as a competitive advantage. And this is the heart of strategic agility: not a dogmatic adherence to specific methods, but rather, the ability to scan, make sense of our landscape, decide, and act on it in increasingly more effective (and ultimately faster) cycles.
References
The basics are in Wardley's first chapter on Medium, all of which you'll also find compiled into an ebook (Wardley Mapping) by Ben Mosior. I recommend a two-minute section of Simon's classic talk Crossing the River by Feeling the Stones for depth on the cycle, and you can follow Boyd further in Chet Richards' book.
- "On Being Lost" - Chapter 1, Wardley Mapping (Medium)
- Crossing the River by Feeling the Stones (Youtube 07:15 – 09:47)
- Certain to Win: The Strategy of John Boyd, Applied to Business (Book)
2. Stages of Evolution
The premise of Wardley Mapping is that everything evolves, with the forces of supply and demand competition driving this evolution.
All of the capabilities we deal with as part of our strategy follow a four-stage trajectory. Everything: product design practices, financial oversight systems, W3C standards, software delivery practices, regulatory frameworks, hardware machining capabilities, time series data processing, agricultural methods — all of these things go through the stages of evolution from Genesis (I) to Commodity (IV), as shown below. For different kinds of capabilities, the descriptors may vary, but the stages are the same:
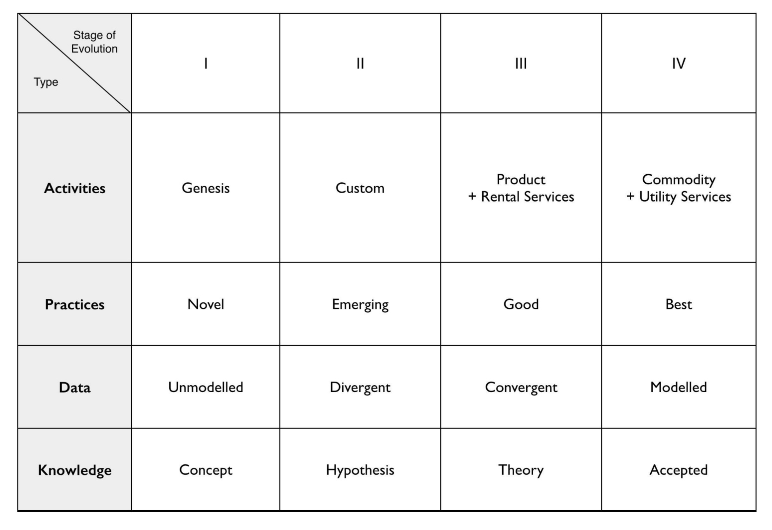
These stages and all their characteristics are expressed as the x-axis of a Wardley map: a placement of position is a specific assertion about behaviors a component will exhibit, implying what kinds of things teams in the space can expect to encounter, and appropriate models for operations and management.
To identify the stage of evolution, we start with what's observable: how does a component exist in the market environment, right now? Each component — again it can be anything: a data platform, a language model, a content syndication pipeline, a research operations function, a new product capability, a distribution channel — each component will exhibit some characteristics or properties that help us determine its state of evolution.
Here's Wardley's cheatsheet for determining that state:
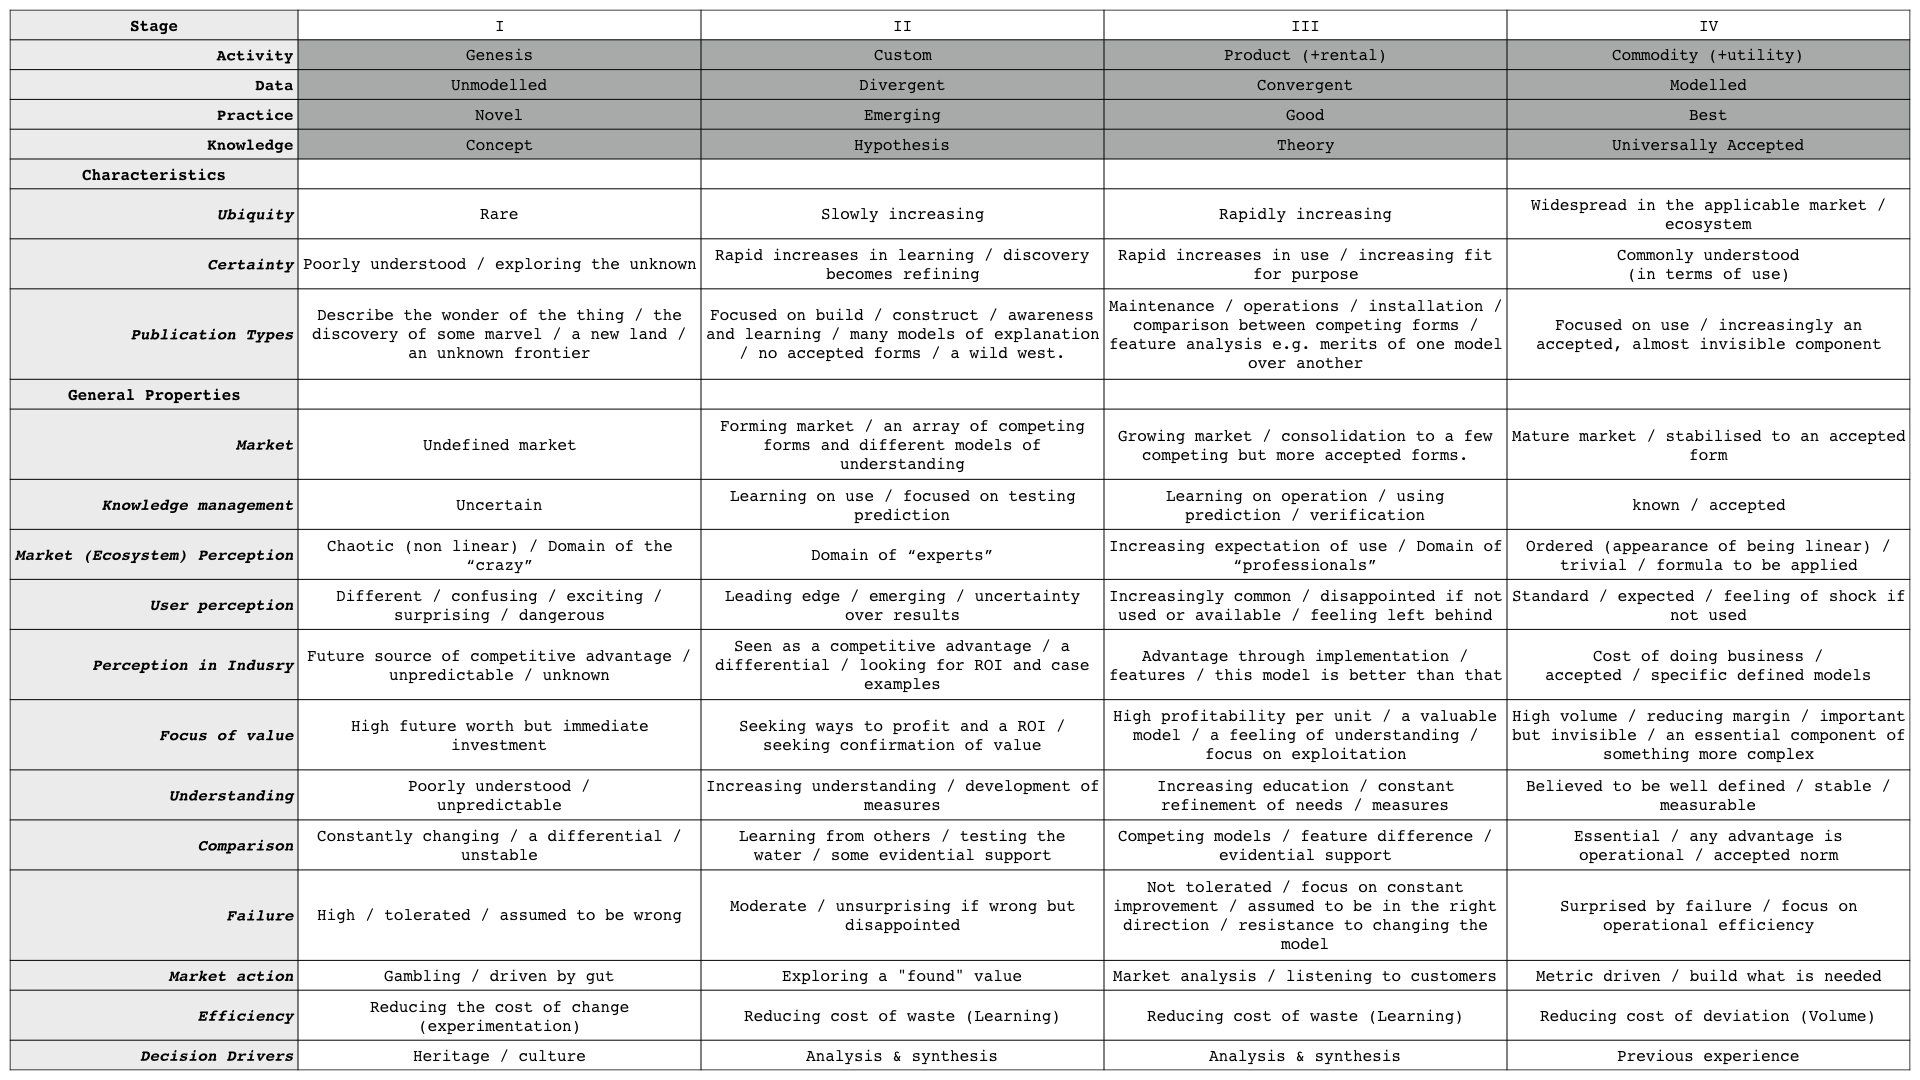
Imagine the area of work we're focusing on right now, or the different activities it oversees, and try to feel out the market state of evolution by comparing it with various factors on the cheat sheet. Not all of the evolutionary characteristics will apply; some set of them will, depending on the kind of component we're evaluating.
Implications for our work
Framing our components and making hypotheses about their state of evolution is the first deliberate and aligning act for moving into Wardley Mapping (keep the cheatsheet nearby.)
For engineering and product leaders: start with "Focus of value" on the cheatsheet and consider what it means for modes of investment and operations. For design, research, and marketing leaders: start with "Understanding" on the cheatsheet and consider the kinds of learning, experimentation, and feedback systems these characteristics imply.
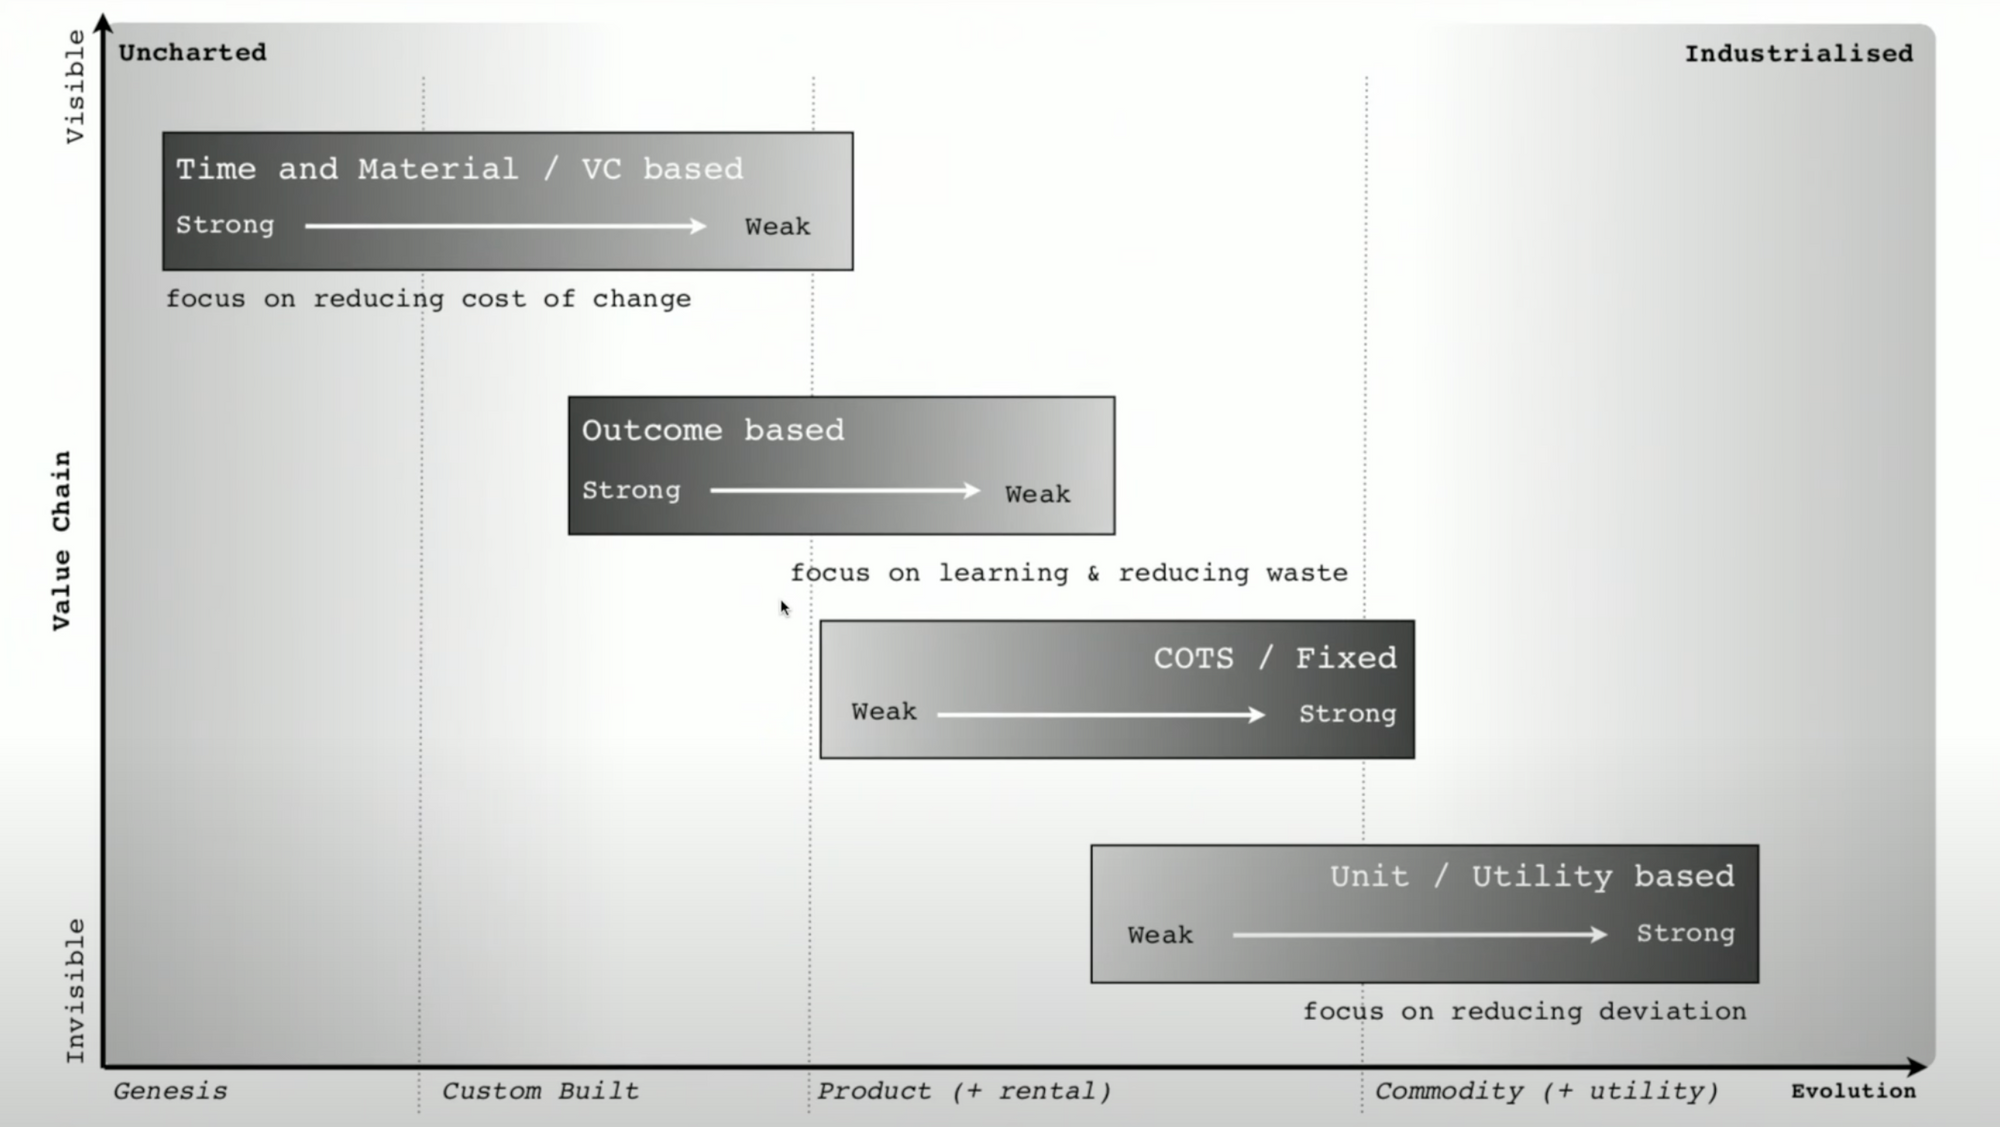
Each stage helps us understand how to manage, fund, and explore value for a given component. Attempting to build a commodity component in-house, creating or maintaining our own data centers, for example, makes sense when we're working a high-volume platform play; the opportunity cost is recklessly high if the value we intend to capture lies in higher-order capabilities like anomaly detection over massive datasets, recommendation engines, or new best practices for design and development.
The evolutionary state of each component sets our pieces on the board; it doesn't tell us about the rules of the game. Movement on the board will happen, and we have no choice over this. Supply and demand competition in the market will push evolution whether we're participating in it or not. (Everything evolves.)
But we may be able to explore, exploit, pressure, delay, or accelerate those things. How pieces move is described by Climatic Patterns (4th area above), and the kinds of moves we can make are described by Forms of Gameplay (6th). We'll look at these in later parts. First, we need the map.
References
These evolutionary stages are a synthesis of diffusion and adoption curves, market signals, and supply and demand expectations. Chapter 2 has an overview of Wardley's perspective on evolution and some of the patterns it entails; Chapter 7 goes into the derivation of the stages. Three minutes of Simon's talk at SEACON:UK show the implications of evolutionary state for build vs. buy decisions.
- "Finding a Path" - Chapter 2, Wardley Mapping (Medium)
- "Finding a New Purpose" - Chapter 7, Wardley Mapping (Medium)
- An Introduction to Wardley Maps - 27:27 – 30:24 – (Youtube, 40m)
3. Context-Specific Maps (∞)
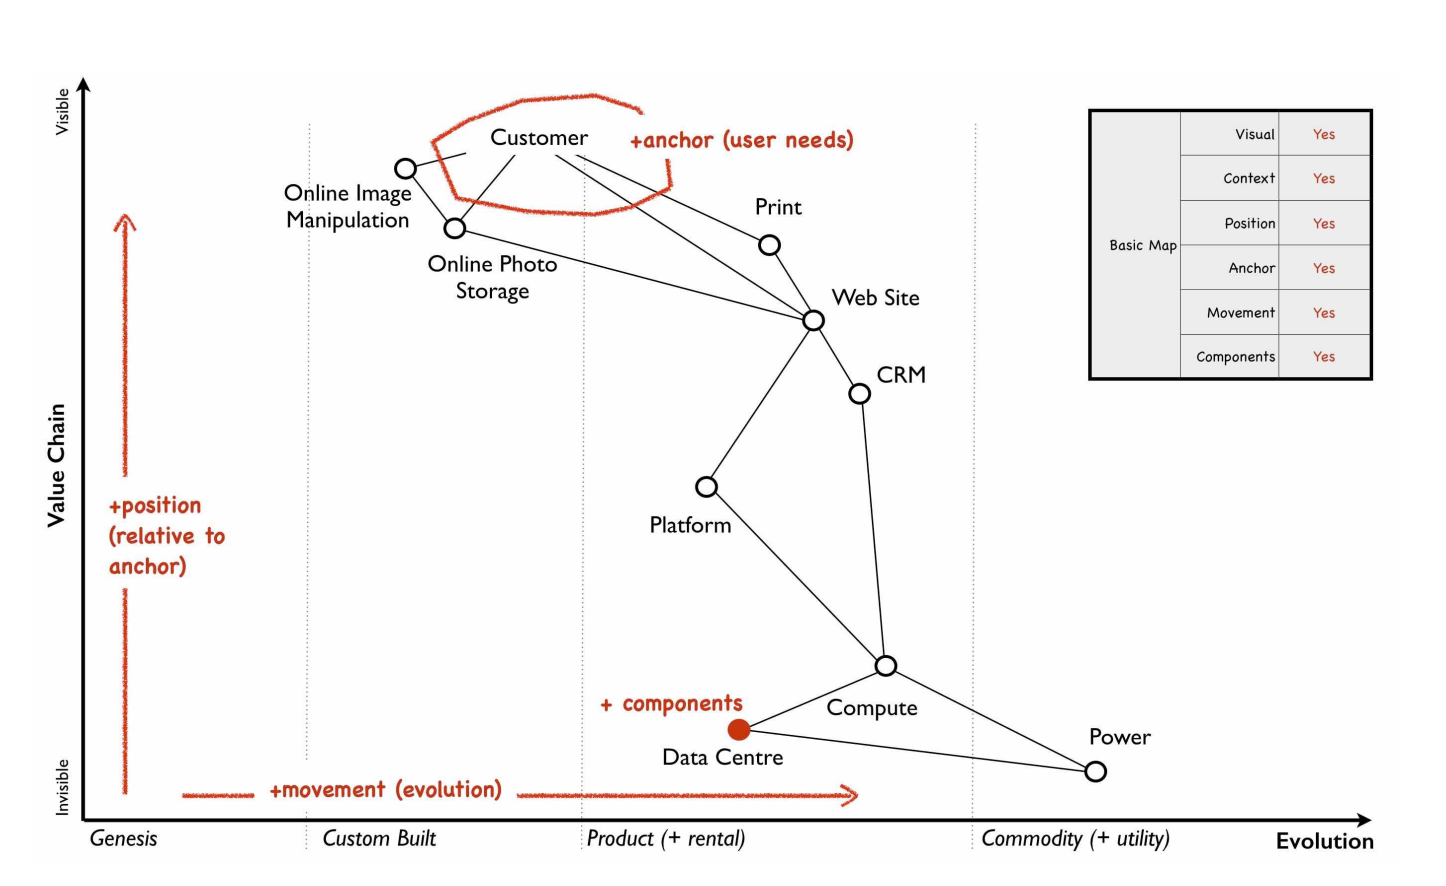
The map is as simple or as complex as you make it out to be. And it's best to start simple. Maps are anchored on user needs. User needs are serviced by value chains. Value chains are scaffolding for establishing components and their dependencies, from the perspective of user visibility. Then we apply the stages of evolution.
Maps come about in the Observe/Landscape step of the strategy cycle — we need to see the landscape before we can understand the conditions that may be acting on it, and the ways we may decide to act.
Simon stresses the fact that maps have specific elements that distinguish them from a systems diagram, a customer journey, or a blueprint: there's an anchor, there's direction, component position has meaning and we can therefore show movement on the map itself. This is especially important for the x-axis of evolution; the y-axis is less strict, driven more by visibility as a heuristic. As we learn to map — in three simple steps! — don't get fixated on making sure these component relationships are perfect.
First, get the pieces on the board, and then see if they're going to be useful through further exploration. It takes practice; through repeated effort, we'll only get better at understanding who should be involved, what makes sense to map, and how we ought to frame and describe those things.
Remember the first step of the strategy cycle: a clear purpose, the reason we're trying to map and effect change in the first place, makes a map coherent. Here's the bare-bones guide to getting started, in three steps.
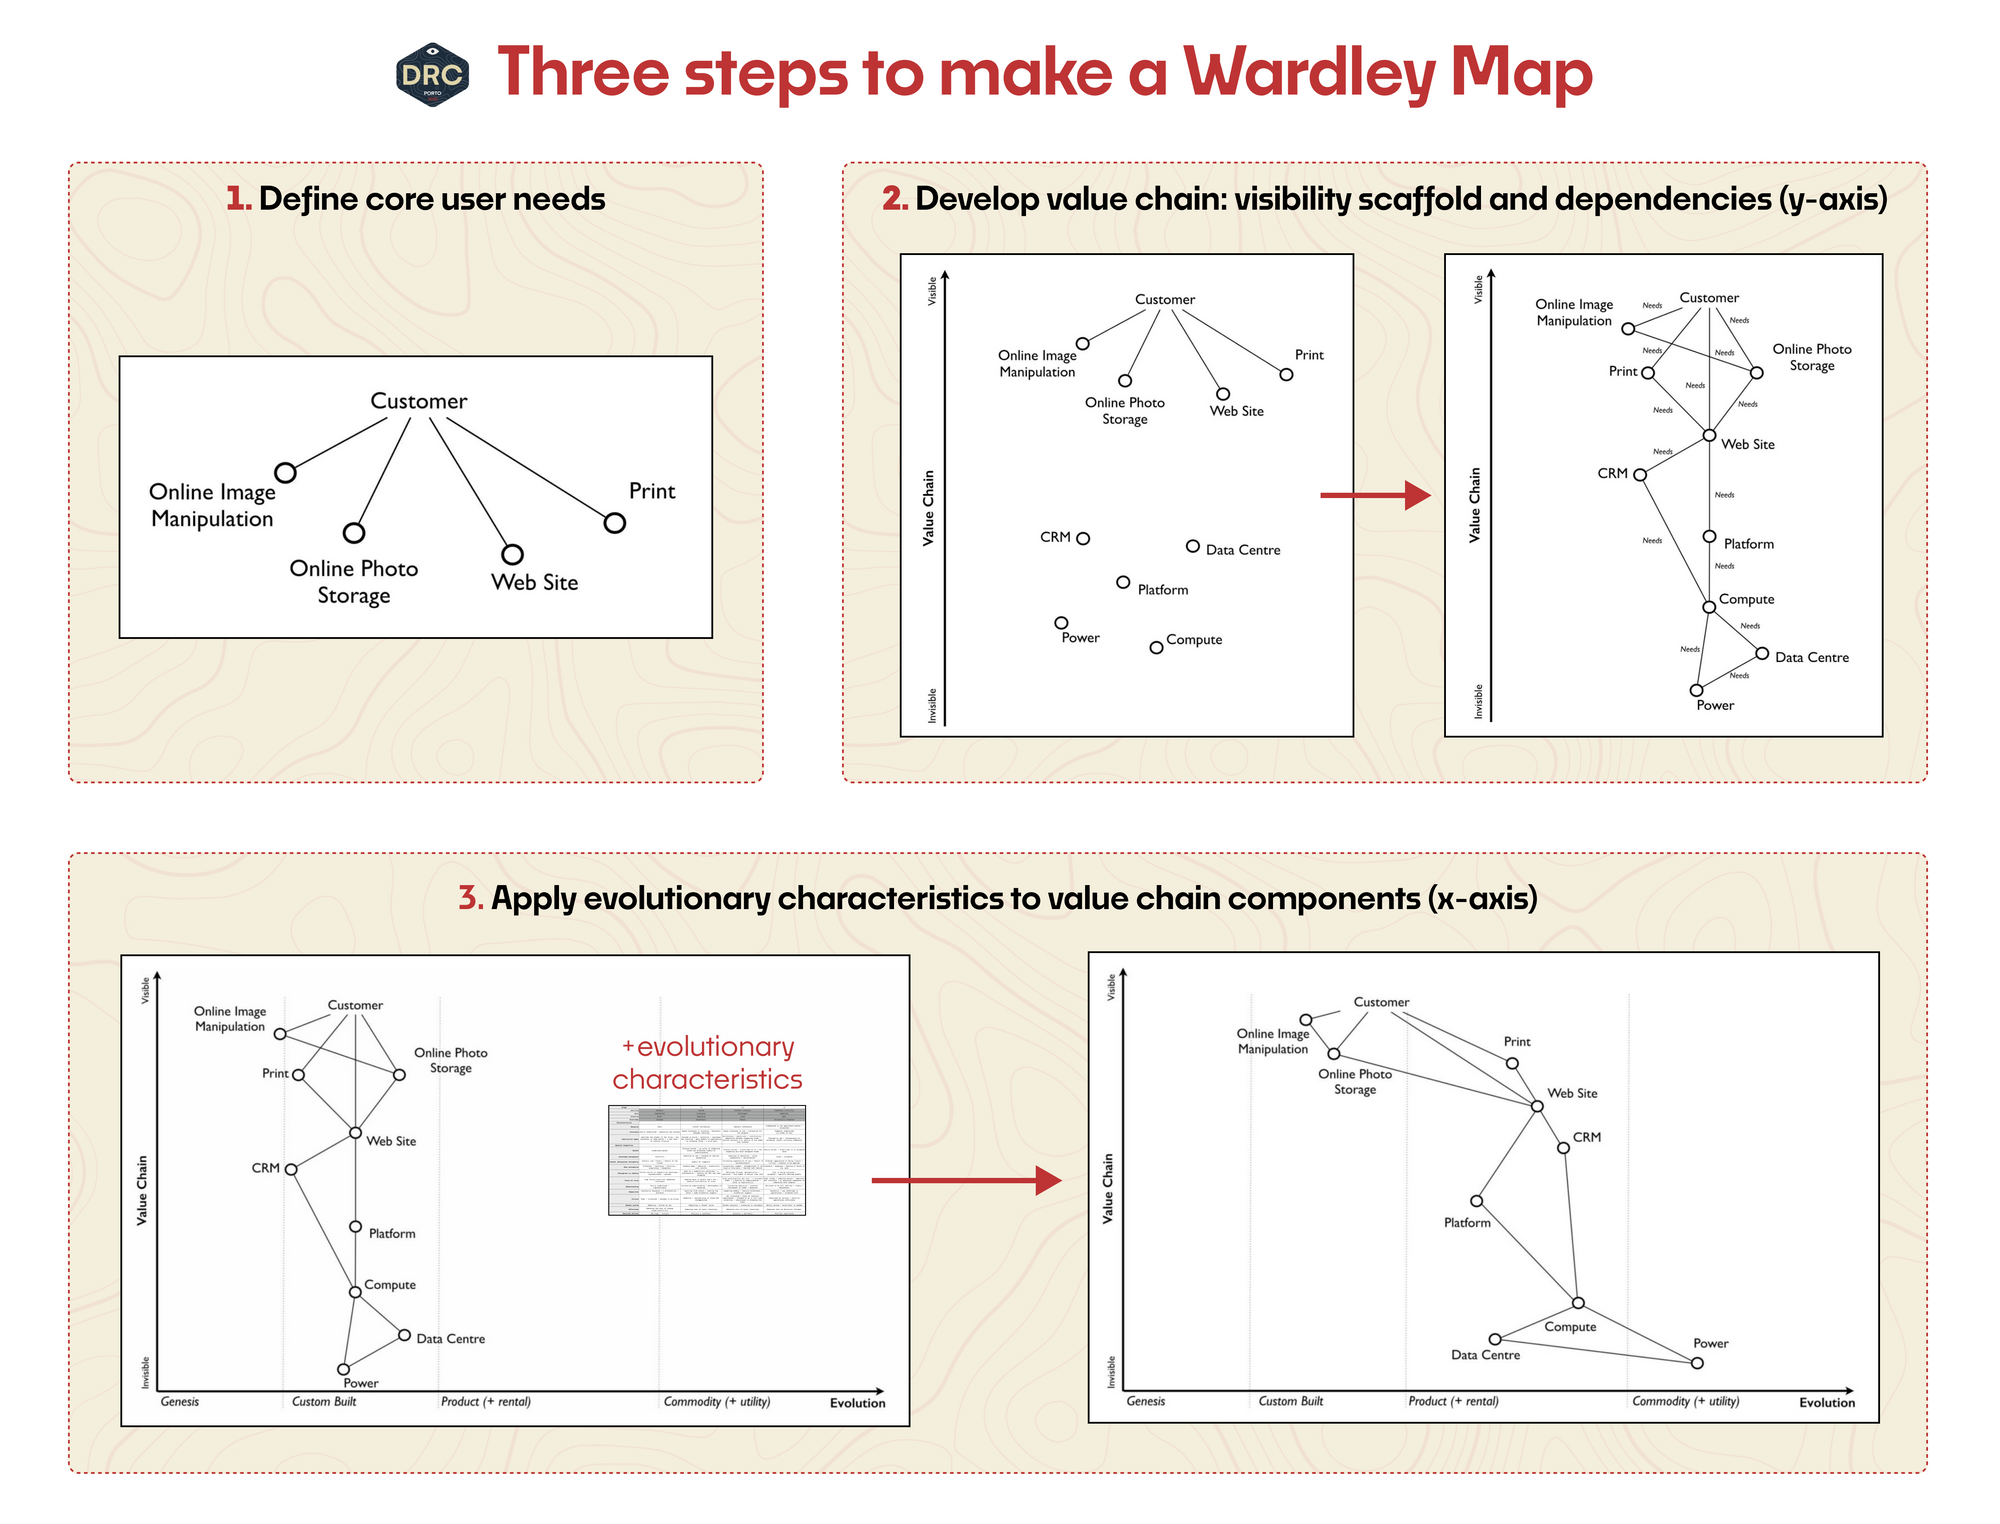
- Define user need[s]
The scope of our strategic situation is defined by our purpose, our purview, and the users we're serving. Who are the users, and what do they need? Make a list of the core capabilities they require. - Develop value chain[s]
For these user needs, we develop a list of salient components, capabilities, activities, and practices supporting those needs. "Visibility to the user" is our scaffolding to determine the dependency order of this value chain along the y-axis. - Apply evolution
Given a fairly-reasonable value chain based on user needs, for each component, set it on the canvas. We make a best-guess judgment on its evolutionary state. And that's a map.
This map is a truly flexible gameboard. Evolution has implications for aspects of organizational composition, financial management, operational models, and organizational culture. Strategic investments, motion, and flows of value can be clearly shown.
When the map makes sense, we can begin to look for Climatic Patterns that show us how pieces move and the kinds of forces that drive those behaviors. We can apply Doctrine to our map and our organization, moving closer to consistent cycles of situational awareness, effective delivery, and strategic agility. We can work with Forms of Gameplay to find where the leverage lies and determine our course of action. This is where the real fun begins — but it's only a distraction if we don't have a map to work with.
Implications for our work
These are maps in the same kind of sense that a topographical map is a map: the position of each piece is meaningful. Each piece can, and will, move over time, and we can show what movement looks like, visually.
This is the basis for tangible discussions of strategy. Unlike a story or a SWOT analysis, it's trivial to create alternative models or annotations. The decision to include and frame a node on the value chain, and the position we give it along the x-axis of a map, are choices that can easily be challenged with alternative models and can be literally pointed to or highlighted to frame productive discussions. When we choose a play to approach our goal, a component either moves as we expect, or it doesn't. We can isolate its position and inspect why.
The first step is to create a map. It should only take a few hours. Mapping efforts can be immediately productive for teams or leaders with a clear-ish purpose and reasonable agency in their organizational/operational scope, and maps can act as living strategic artifacts so long as that scope is useful and remains coupled to a larger purpose. It's a medium-paced game, and the real world provides useful feedback so long as we have clear hypotheses (maps) and we pay attention, making sense of what we see.
As a strategic tool, they operate on months-long and years-long time scales: well-suited for a product line, divisional, or organizational purview. A map, evaluated at regular intervals, is the antidote to the inevitable crush of annual planning cycles. Strategy is a continuous cycle that must move coherently at a wide range of frequencies. For any scope, the map moves when the market does, as should our awareness of the situation.
References
Wardley's second chapter details the breakdown of a map and its specific visual characteristics. You can see a course and a workshop guide from smart people. And any of Simon's "Crossing the River by Feeling the Stones" talks gives a strong overview of mapping and its broader perspective; I like the recording from GOTO Copenhagen 2018 linked below.
- "Finding a Path" - Chapter 2, Wardley Mapping (Medium)
- Learn Wardley Mapping (learnwardleymapping.com)
- How to run a Wardley Map workshop (pipdecks.com)
- Crossing the River by Feeling the Stones, GOTO 2018 (Youtube, 44m)
Pointing at the moon
The method, in itself, is never the object. A map that says "X marks the spot" carries no guarantee that we get to buried treasure first, or even get there at all. Wardley Mapping is one framework — an excellent one — that can help us make effective strategic decisions and learn to do so better and better, over time. (We can get better and better at predicting where the treasure is, and taking action to get there.)
If you haven't already, choose a scope and give it a try. The value chains we care about — starting from user needs — are likely to cut across org and team composition, codebase structure, user journey stages, suppliers, ongoing initiatives, and competitive motion. Mapping's first use is to provoke the right questions and begin the conversations that move us toward productive situational awareness.
Here's the bare playing field: print it, drop it into Figjam, Miro, or Google Slides, and remember to start with user needs and the value chains that support them. You can take it and use it as you please — all of Wardley Mapping is offered as Creative Commons with the CC BY-SA 4.0 license.
I'm becoming familiar with Climatic Patterns, and find my own experiences aligning with Wardley's Doctrine. It takes time and direct experience to understand how Forms of Gameplay unfold in the market. As my consulting and projects work more with these topics, we'll see additional parts in this series on Wardley Mapping.
This is part of an ongoing exploration into research as it co-evolves with product practices and re-integrates into the organization.
For weekly thoughts on the nexus of products-organizations-process-strategy, and updates on larger resources like this, consider joining my newsletter.


