
![Maintaining Models [LC05]](https://storage.ghost.io/c/d1/ba/d1baee41-d47e-4387-b3f4-1436f65958e0/content/images/size/w30/2024/05/7-cascade.png)
Stories
We make sense of the world with stories. We tell ourselves how things are, how things went, and how things will go. These stories about our situations are powerful individually, and even more so when leaders wield them well inside an organization.
Repetition is a key aspect of leadership. It’s necessary to instill the right sense of context, the right interpretation of events at hand, the right motive for the work to come. And repetition works. Leaders who repeat stories often enough will build them into the organizational collective consciousness. (Recognition, familiarity, trust: the same principle drives massive spend in corporate brand marketing.)
The power and the danger of these stories is that, accepted and instilled into organizational consciousness, they can be used as blunt weapons. Nuance and detail go out the door. It’s impossible to draw a circle around one small element of the institutionally accepted story, or simply understand how small and focused updates may cascade through the story-system.
An entrenched story is difficult to alter with any nuance unless that alteration comes from the same vector, and with the same strength of repetition, as the prior version.
While they're important in establishing a shared cultural lore — how did we get here? how do we do things? why have we decided to work this way? — the unmediated, unsubstrated nature of a story makes it a particularly bad tool for plans and collective decisions.
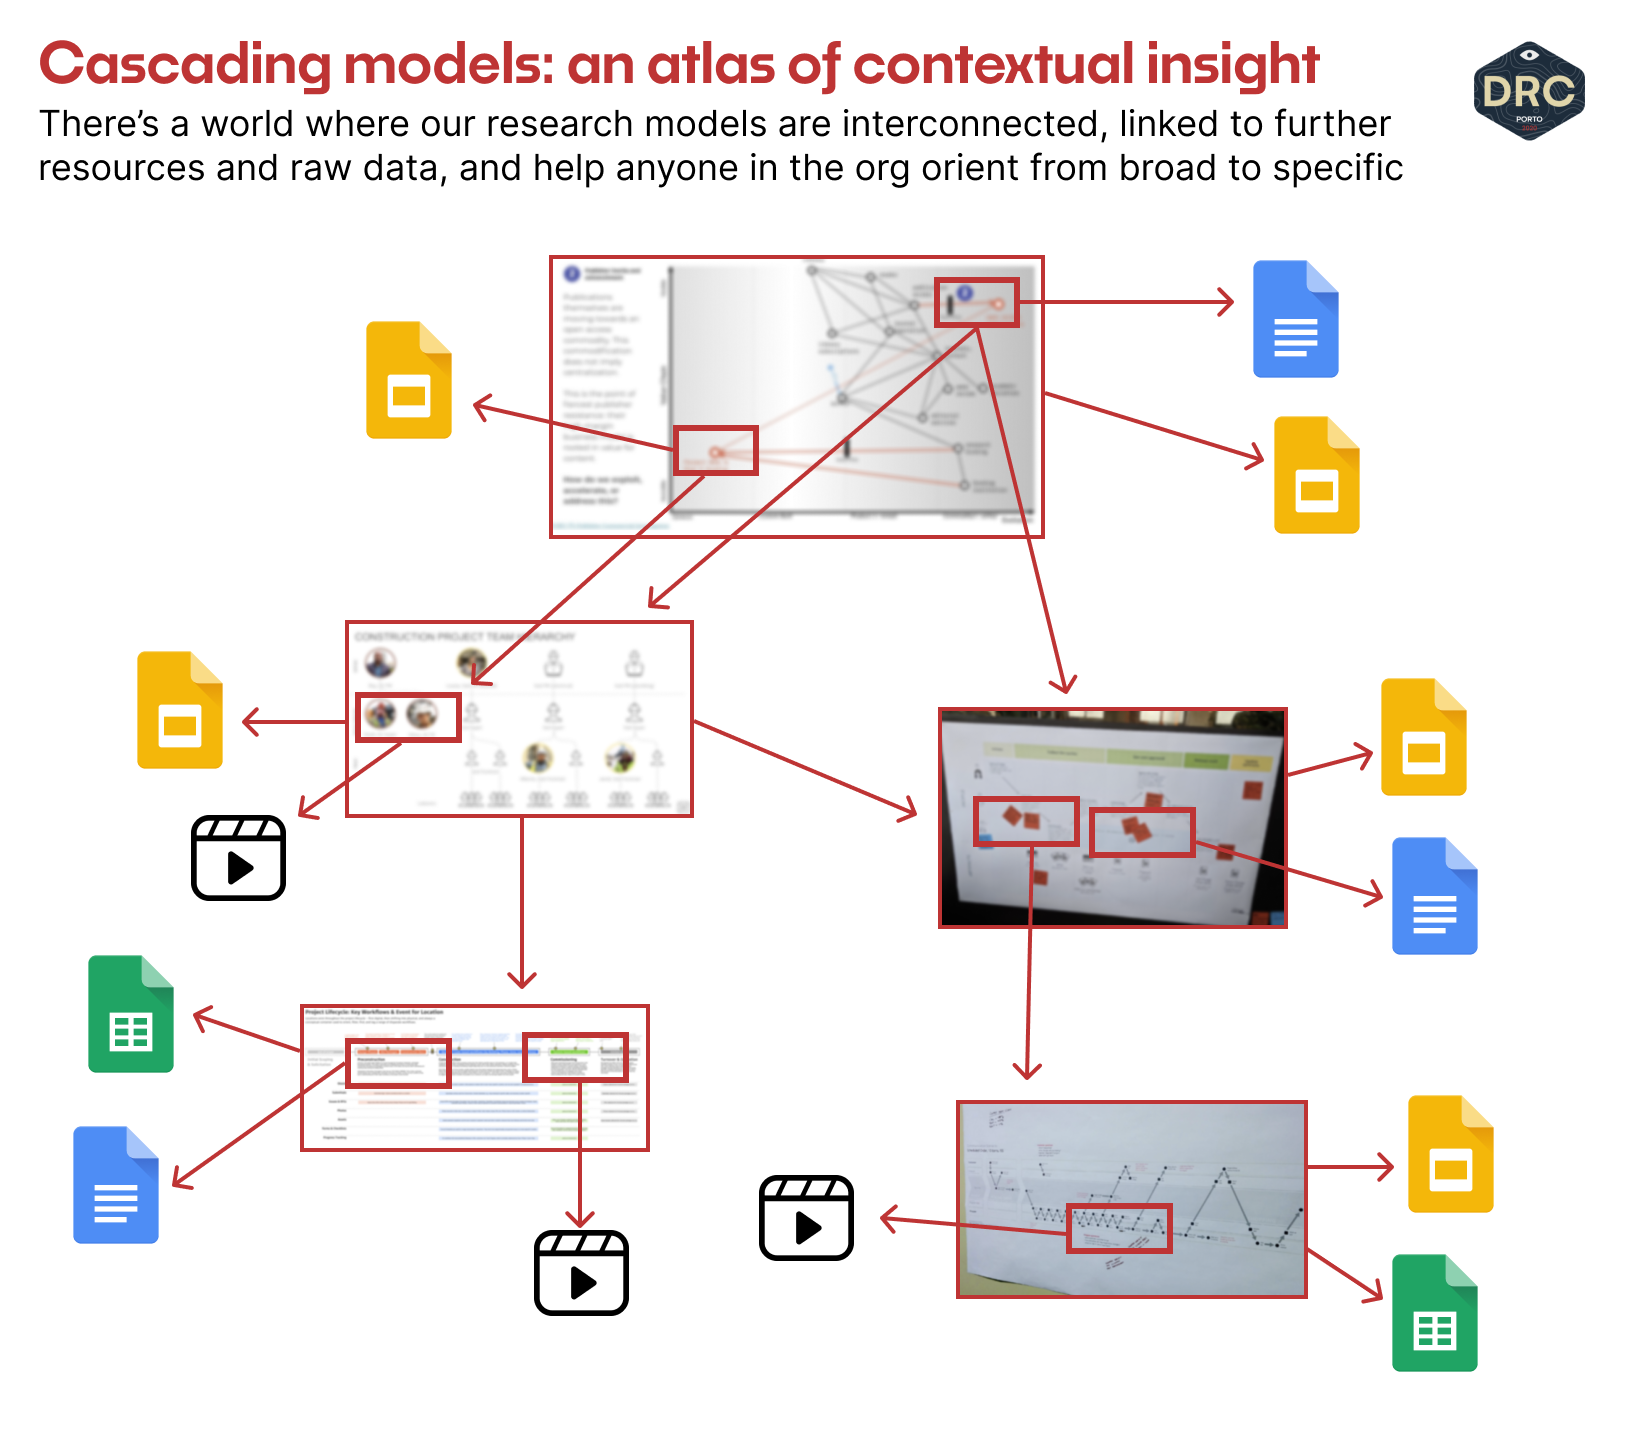
Maps and Models
There’s power in making the abstract and invisible tangible. For our purposes, that tangible may mean you can drag a cursor near it, point a digital arrow at it, or draw a circle on it with a pen.
Visual models — call them what you like: maps, frameworks, models, diagrams — encode shared understanding such that it can be challenged. So that others can copy it, paste it, move something around, draw a big red circle around the change, and say are you sure it’s not like this?
Moving from intangible to tangible is an art form. Whatever our input, strong visualization is one of the more useful outcomes of collaborative sense-making and synthesis. A concise, articulate, and well-developed artifact: a totem for the information it represents, and a visual-over-verbal vector for dissemination.
A good map or model is an orientation device. I tried to lay out this kind of vision in User Models for Product Work, imagining a state where our organizational intelligence is linked together in some visual and navigable hierarchy of reality.
At the time, my focus was much more on the output of research rather than the information an organization requires to maintain shared consciousness and make effective decisions. (When our learning is well-deployed, there’s excellent overlap.)
Refresh Rates and Regeneration
No individual picture will ever be “right,” but each of them can be useful in articulating the rationale for certain decisions or predicting the outcome of product changes.
At every level of scale, our corresponding artifacts imbued with collective knowledge must be updated in light of new information. They move at different cadences, with smaller scopes (execution level) moving faster — days or weeks — and larger scopes (landscape level) moving much more slowly — months and years.
Just as we need practice and skill in building our frameworks, we need practice and skill in repeating and reincorporating them into the organization, the same way good leaders use effective stories. On top of that, we need new operating loops for updating them or maintaining alternate versions of them as the evidence allows.
The opportunity-solution tree in Teresa Torres' Continuous Discovery is often overlooked: teams focus on cadenced interviewing and forget that interviewing is an activity meant to gain information about opportunities and assumptions encoded in the tree. Simon Wardley explicitly speaks about the strategy cycle as the larger loop that Wardley Maps live in: they merely represent the game board, and they have to be kept up to date.
In much of my work with product teams, we end up building new pictures that help them interpret their product context and make more effective decisions. We leave a trail of what was learned, an articulation of the situation, and an artifact that can become a living and challenge-ready avatar of shared intuition.
To get there, though, we can't just replace stories with a picture that gets framed and set aside on the shelf. We have to instill an understanding of these artifacts as malleable, tangible, and collectively experimentable pieces of common property. We need owners, maintainers, or at minimum a maintnenace cycle that knocks the dust off, checking our artifacts for the soundness of relevance of their information.
That cascading, all-encompassing, visually-modeled atlas of contextual insight sure sounds nice... but let's start with one or two good models first, and see if we can keep them alive and well over time.
This is Loops and Cycles, a weekly mailing list exploring the processes that produce good products (and organizations). Share it with your team, send it to a friend, or send me your thoughts and questions.
![Three Problem Attributes [LC32]](https://storage.ghost.io/c/d1/ba/d1baee41-d47e-4387-b3f4-1436f65958e0/content/images/size/w30/2026/02/product-problem-ternary-focus--1-.png)
![Seeding a Product Framework [LC31]](https://storage.ghost.io/c/d1/ba/d1baee41-d47e-4387-b3f4-1436f65958e0/content/images/size/w30/2025/12/full-framework-thumb--1--1.png)
![Maintenance Required [LC30]](https://storage.ghost.io/c/d1/ba/d1baee41-d47e-4387-b3f4-1436f65958e0/content/images/size/w30/2025/09/Screenshot-2025-09-01-at-17.23.00-1.png)